Semiconductor etching spits out an acid‑fluoride cocktail loaded with silica and trace metals. A staged train — pH neutralization, chemical precipitation, and ion‑exchange — is how fabs drive fluoride to ≈10 mg/L and metals to sub‑ppm, even as flows swing wildly.
Wet etching effluent from semiconductor fabs is typically highly acidic (pH ~1–3) and rich in dissolved silica and fluorides. Hydrofluoric acid (HF)–based etches dissolve SiO₂, forming hexafluorosilicic acid (H₂SiF₆), while strong oxidizers (e.g., HNO₃) are also common. Typical raw etch waste can contain fluoride on the order of hundreds to thousands of mg/L and substantial silica (often as fine colloidal SiO₂) (pubs.acs.org).
Metal‑containing reagents (e.g., tungsten hexafluoride for tungsten CVD, metal‑salt cleaners, or incidental contamination) impart heavy metal ions (e.g., W, Mo, Ni, Cu) at up to sub‑mg/L levels. A Taiwanese study of semiconductor WWTP effluent reported dissolved W ≈430 μg/L and Cu ≈15 μg/L (www.sciencedirect.com) (vs natural background <0.1 μg/L W (www.sciencedirect.com)). By comparison, surface waters target tungsten <0.1 μg/L and Cu <2 μg/L. Fluoride discharge is often limited to ≈10 mg/L (pubs.acs.org), and heavy metals to ~0.1–3 mg/L. Indonesian guidelines (e.g., PermenLHK standards) typically require pH 6–9 and heavy metals in the single‑digit mg/L range. In practice, semiconductor fabs aim to polish effluent to sub‑ppm levels of most metals and low mg/L for F⁻ — orders‑of‑magnitude removal for a stream that can swing between batch acids and rinses.
The design imperative is clear: handle extreme variability and achieve ~99.5% removal of fluoride (pubs.acs.org) and >90–99% removal of metals (e.g., IBM data show Mo/W removal to <0.1 mg/L, patents.google.com).
Etch effluent: chemistry and targets
Three contaminants dominate the flowsheet: fluoride (including H₂SiF₆), silica, and transition‑metal ions. Each responds to different pH and ligand chemistry. That’s why the treatment train stacks unit processes — equalization, staged neutralization, precip/flocculation, clarification, and dual‑bed ion exchange — to meet tight limits such as F⁻ ≈10 mg/L and metals in the sub‑ppm range, with final pH 6–9.
Equipment choices follow the chemistry. Equalization evens out shock loads; precise dosing and mixing determine precipitation efficiency; and polishing media selectivity decides whether trace W, Mo, Ni, and Cu end below detection. Inline monitoring and automation are not add‑ons here; they are how fabs keep within the pH and dose windows that make the reactions work.
Equalization and staged pH neutralization
The first unit is a robust neutralization stage. An equalization tank buffers fluctuating acid loads, maintaining continuous flow and pH monitoring. Alkali — typically lime (Ca(OH)₂) or NaOH — is dosed slowly to raise pH toward ~8–9, neutralizing free H⁺ and converting hexafluorosilicic acid to fluoride and silica while setting up conditions for precipitation of CaF₂ and metal hydroxides (which drop sharply above pH≈8.5). Industry practice from plating/metal finishing adjusts to pH 8.5–10, most commonly ~9.2 (www.sterc.org; the same STERC manual notes a most‑common precipitation pH target of ~9.2: www.sterc.org).
In a recent semiconductor study, raising etch wastewater to pH 8.5 with Ca²⁺ achieved ~99.5% defluorination, from 1800→10 mg/L F⁻ (pubs.acs.org). Specific outcomes can be estimated: for 1800 mg/L F⁻, stoichiometry demands Ca²⁺ on the order of half the molar equivalent, which indeed yielded 99.49% removal (pubs.acs.org). This bedrock alkaline step is mandatory; if pH remains low, metals stay soluble (pmc.ncbi.nlm.nih.gov).
To avoid rapid silica gel formation and maintain co‑precipitation efficiency, neutralization is staged: first to pH ~6–7, then to ~8.5–9 with coagulant addition. Inline monitoring keeps the stream within 8.5–9.5 before clarification. Many plants pair this control logic with precise chemical feed via a dosing pump and the usual sensors and mixers provided as water‑treatment ancillaries.
Chemical precipitation and clarification
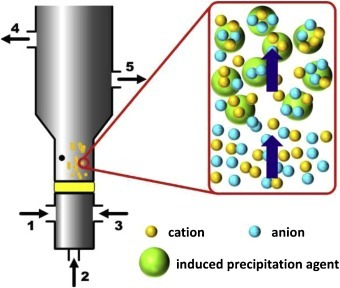
Once neutralized, chemical precipitants and coagulants are added to capture and remove contaminants. Common reagents include lime (Ca(OH)₂), alum or ferric salts, and polymers. Calcium (from Ca(OH)₂ or CaCl₂) precipitates fluoride as CaF₂; the study above yielded a high‑purity CaF₂ sludge (pubs.acs.org). Metal co‑precipitation occurs simultaneously as hydroxides or oxyhydroxides: Fe³⁺, Al³⁺, Ni²⁺, Cu²⁺, Zn²⁺. Sulfide (e.g., Na₂S) can optionally be used for extremely recalcitrant metals, but typically hydroxide precipitation suffices (pmc.ncbi.nlm.nih.gov).
Effective precipitation hinges on: (a) driving pH into the optimum range, (b) selecting specific precipitants for target metals, and (c) precise dosing control (pmc.ncbi.nlm.nih.gov). Ni and Cu have minimum solubility around pH 9–10, while silica and fluoride removal peak at approximately 8.5–9 (www.sterc.org; pmc.ncbi.nlm.nih.gov). In practice, labs or jar tests determine chemical doses: Ca²⁺ is added until lab samples meet F⁻ <10 mg/L (per pubs.acs.org), then fine‑tuned.
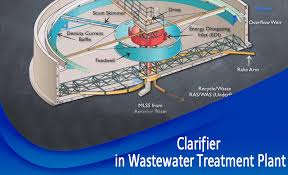
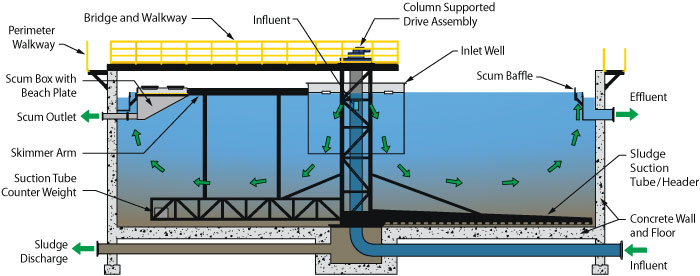
Flocculant addition (polymer) ensures settleable sludge, and a sedimentation tank removes mass into sludge — typically ~50–90% of COD, TSS, and metals — before polishing. Typical residual loads post‑precipitation might be on the order of a few mg/L metal (e.g., <1 mg/L Fe, Al; 0.1–0.5 mg/L Cu/Ni), though final polishing is needed. Fabs often opt for a clarifier to remove flocs or choose a DAF unit where footprint or solids characteristics favor flotation; compact lines may use a lamella settler for higher rise rates.
Chemical supply and control are not afterthoughts in this stage. Coagulant selection aligns with a catalog of coagulants, and tuning the charge balance with flocculants can improve clarifier stability as loads vary.
Ion exchange polishing for sub‑ppm metals
Even after precipitation, trace contaminants often exceed discharge limits. An ion‑exchange (IX) polishing step is essential for sub‑ppm removal. A strong‑acid cation (SAC) resin bed removes residual cationic metals (Cu²⁺, Ni²⁺, etc.), and a strong‑base anion (SBA) resin targets anionic species (e.g., F⁻ or oxyanions like WO₄²⁻). Recommended operating conditions are alkaline influent (pH ~8–9) and long contact time to maximize ion uptake (pmc.ncbi.nlm.nih.gov).
Empirical results show ion exchange can reduce metal levels dramatically. IBM reported that passing post‑etch streams (containing Mo, W, Cu, Ni) through an SBA column removed >99.9% of Mo and W, yielding <0.1 mg/L in effluent (patents.google.com). Cation resins (in H⁺ form) can similarly reduce Cu/Ni to <0.1–0.5 mg/L, effectively polishing to meet stringent standards. The design typically uses two columns in series: SAC (which liberates H⁺) followed by SBA (which liberates OH⁻ or Cl⁻). Regeneration cycles (with HCl/NaOH brines) recover metals into a small‑volume sludge/waste brine for safe disposal or recycling. With proper design, resin beds achieve ≥95–99% removal of trace metals.
The ion‑exchange stage raises pH again (from ~8.5 back to ~6–7 via H⁺ release), so a final neutralization/finish step may be necessary. Automatic pH adjustment (e.g., NaOH dosing) ensures final effluent pH falls within 6–9, as required by regulations. System suppliers typically package this polishing step as ion‑exchange systems with interchangeable ion‑exchange resins to match site‑specific metals and anions.
Performance, variability, and outcomes
In combination, the neutralization–precipitation–IX train can achieve the removals required for compliance. Quantitatively: fluoride is reduced >99% (e.g., 1800→<10 mg/L; pubs.acs.org); suspended solids (TSS) are cut by 80–90% in clarifiers; heavy metals by 90–99+% (e.g., 0.43 mg/L W → <0.001 mg/L if further managed by resins, and Cu/Ni from mg/L down to 0.1–0.5 mg/L or less) (www.sciencedirect.com). After treatment, final effluent readily meets typical limits (e.g., Cu ~0.5 mg/L, Ni ~0.5 mg/L, F⁻ ~10 mg/L, pH 6–9). For context, Taiwan’s (former) semicon rule targeted Cu 0.1 mg/L; with the above train these values are technically achievable (pubs.acs.org; patents.google.com).
By adhering to equalization, staged neutralization, precip/flocculation, clarification, and dual‑bed ion exchange — and by holding the pH windows that make CaF₂ and metal hydroxides form — plants handle variable batch flows while delivering stable, low‑level effluent. Supporting metrics: one pilot neutralization achieved 99.49% F⁻ removal with Ca²⁺ at pH 8.5 (pubs.acs.org); pH 9.2 precipitations are generally optimal (www.sterc.org); and ion‑exchange polishing routinely drives Mo/W to <0.1 ppm (patents.google.com). Collectively, these data‑backed steps also cover recalcitrant contaminants (W, Mo, CN, F⁻, etc.) below stringent standards.
Notes and sources
Sources: Peer‑reviewed case studies and industrial data on semiconductor effluent. For example, Zhou et al. report fluoride removal to 10 mg/L (99.5% reduction) using Ca²⁺ at pH 8.5 (pubs.acs.org). A hazard‑materials study found W ≈430 μg/L in treated effluent (www.sciencedirect.com), underscoring the need for <0.1 ppm limits. Industry guides (STERC) confirm metal precipitation at pH≈9 (www.sterc.org). Heliyon et al. review agrees that raising pH, proper precipitant choice, and precise dosing are critical (pmc.ncbi.nlm.nih.gov). IBM’s patent data show dual resin polishing can remove Mo and W to <0.1 ppm (patents.google.com).
References: Hsu et al. (J. Hazard. Mater. 2011) on effluent metal loads (www.sciencedirect.com); Zhou et al. (ACS ES&T Water 2023) on F⁻ precipitation (pubs.acs.org); Oladimeji et al. (Heliyon 2024) on precipitation/IX best practices (pmc.ncbi.nlm.nih.gov; pmc.ncbi.nlm.nih.gov). STERC is a U.S. plating‑industry P2 reference (www.sterc.org). Each cited work details the relevant treatment performance and parameter optimization.
