In seawater reverse osmosis, every bar of pressure that disappears in pipes shows up on the power bill. Data-backed design and control choices now put hard numbers on how to keep that energy in play — especially when pumps, energy-recovery devices, and membranes all come online at once.
High-pressure reverse osmosis (RO) piping is where quiet inefficiencies add up fast. In practice, seawater RO (SWRO) plants can lose several bars of pressure in piping alone (researchgate.net). In one 1,000 m³/day case, pressure across the RO skid fell from 56.5→55.2 bar — a 1.3 bar drop that translated to ~0.09 kWh/m³ (9% of a ~1 kWh input) (researchgate.net).
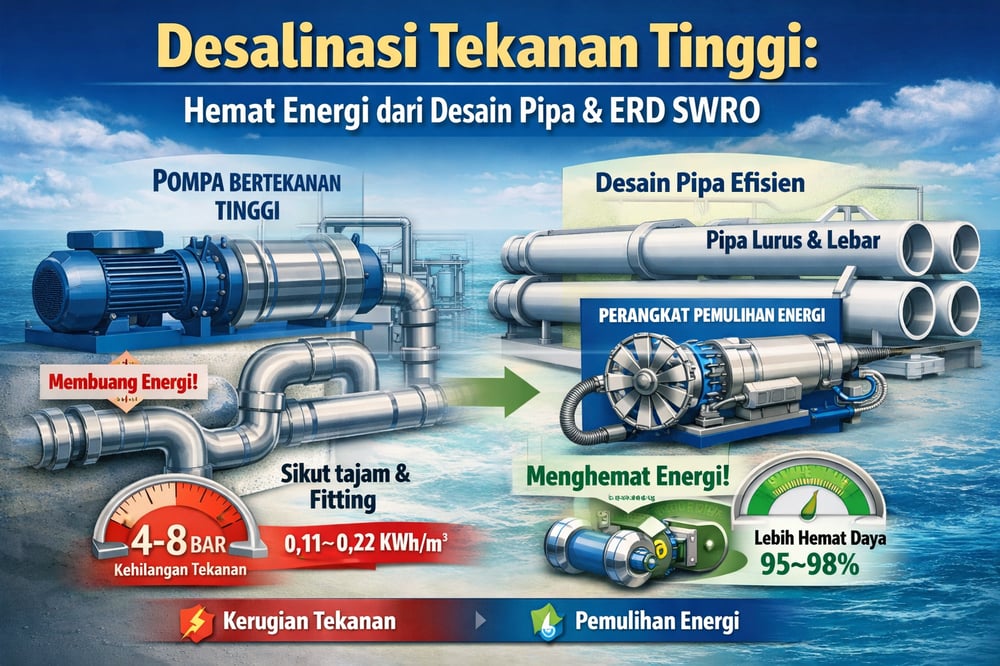
The stakes are bigger in poorly optimized loops. A worst‑case survey logged friction plus fittings at ~4–8 bar of loss, equal to 0.11–0.22 kWh/m³ (researchgate.net). The design implication is blunt: each extra meter of head must be delivered by pumps (using ~0.07–0.08 kWh per bar), so pipe diameter and layout decisions carry direct OPEX consequences (researchgate.net).
These dynamics play out inside high-pressure loops that connect pumps, energy‑recovery devices (ERDs), and membranes on RO trains, including large SWRO systems such as /products/sea-water-ro and broader membrane platforms used in industrial and municipal water treatment like /products/membrane-systems.
High‑pressure piping losses and sizing
Modeling shows that upsizing and straightening lines pays back in bars — and kilowatt‑hours. One RO skid saw total loss fall from 2.77→1.61 bar when piping was upsized by 20% and fittings minimized, a ~1.16 bar improvement worth ~0.08 kWh/m³ (researchgate.net). A 500 m³/day system posted a 2.71→1.63 bar reduction — 1.08 bar saved and ~0.074 kWh/m³ off the energy tab (researchgate.net).
In business terms, saving 0.08 kWh/m³ at $0.10/kWh is ~$0.008/m³; on a 10,000 m³/day plant that’s 800 kWh/day — roughly $80 per day — of electricity avoided. Materials and fittings matter, too: smooth, corrosion‑resistant pipe (e.g., stainless steel or FRP) rated to design pressure (ASME‑B31.3 style) curbs turbulence, while every elbow, valve, or sudden contraction can add about 0.1–0.3 bar of loss (researchgate.net). Elevation choices (pump suction floors, supports) alter net head, and bypass loops or manifolds should avoid extra throttling valves — even small controls can tack on 0.1–0.5 bar each.
The cumulative energy impact is explicit. If a plant’s 55 bar pump squanders 5 bar in losses, that alone costs ~0.4 kWh/m³; in contrast, well‑designed systems keep losses under 2 bar (≈0.08 kWh/m³) (researchgate.net, researchgate.net). Given modern SWRO runs ~2–3 kWh/m³, trimming ~0.1–0.2 kWh/m³ is a meaningful efficiency gain.
ERD integration and loop routing
Energy‑recovery devices (ERDs — hardware that reuses brine pressure) sit between the RO membranes and pumps, so their lines must be just as clean. A typical scheme uses a variable‑frequency drive (VFD) booster pump to raise feed part‑way, a high‑pressure pump (HPP) to reach design pressure, and an ERD (e.g., Pelton turbine or isobaric exchanger) on the brine. One example: the Palmachim SWRO plant used a booster pump + VIVID and an HPP with soft‑start feeding a Pelton ERD (crenger.com).
Piping layout typically routes concentrate from the RO skid to the ERD inlet, with ERD discharge returning to the feed line between booster and HPP (crenger.com). These lines carry high‑pressure brine and should be sized for the brine flow — typically 30–50% of feed flow — at pump discharge pressure. Gentle bends and long‑radius elbows help because ERDs can only recover the net pressure difference in the loop; extra friction directly reduces recovery.
Device selection sets the ceiling. Modern isobaric exchangers recover ~95–98% of brine pressure energy, far above turbine‑type units (danfoss.com). Danfoss’s MPE 70 (a motor‑driven PX) is marketed with “unparalleled” energy efficiency and safe operation at varying flows by eliminating rotor overspeed (danfoss.com). In practice, even with a turbine ERD (~70–85% efficient), designers target the ERD loop (suction + discharge) for ≤~0.5–1 bar total loss to maximize net recovery.
Controls, sensors, and valve strategy
Coordinating pumps, ERD, and membranes hinges on automation. A PLC/DCS (programmable logic controller/distributed control system) manages setpoints via PID loops (proportional‑integral‑derivative control), taking input from feed/brine pressure transducers at membrane inlet/outlet, flowmeters on feed and permeate, and conductivity/TDS meters on product. Speed control is standard: a VFD on the booster pump and a soft‑start (or inverter) on the HPP. One documented setup used a VFD‑driven booster (BP) and an HPP motor with a thyristor soft‑starter (crenger.com, crenger.com), allowing smooth ramp‑up and limiting initial torque/current to reduce electrical stress (crenger.com).
Valve philosophy follows from the physics: controlled valves sit on feed or recirculation lines for startup/shutdown; during steady operation, lines run “wide open.” Throttling valves are avoided because they waste head and can cause cavitation damage (crenger.com). In the Palmachim example, a normally‑closed bypass was reserved for specific closed‑circuit loops (crenger.com).
Matching HPP and ERD dynamics is another control layer. Many ERDs run in “pressure‑following” mode, passively absorbing brine pressure to assist the pump. Advanced units such as the MPE 70 integrate motor control so the ERD can actively modulate speed, prevent spin, and track flow changes — tied into the same instrumentation map that monitors pump discharge and ERD inlet pressures (danfoss.com).
Startup and shutdown sequencing
The most delicate moments are the first and last minutes. Membrane vendors typically cap pressure slew rates at ~0.5–0.7 bar/s at the inlet, a limit that makes automated sequencing non‑negotiable (crenger.com).
A representative five‑step startup goes like this (crenger.com): first, start the booster pump (VFD) at a defined ramp (e.g., 1 bar/s) to a modest feed pressure (~12 bar). Second, spin the HPP and ERD without motor power — booster torque alone — letting them free‑wheel until system pressure reaches ~30 bar in ~40 s. Third, bring the HPP motor online with a current/voltage ramp (soft‑start) to reach full speed and design pressure (~60 bar) over tens of seconds (crenger.com). Throughout, the PLC enforces the ≤0.7 bar/s ramp limit (crenger.com). In one case, after ~40 s of controlled spinning the HPP pressure rose slowly, and the motor ramp completed the final tens of bars (crenger.com). This approach avoids a single sudden valve opening, which can induce cavitation and force a 15–20% oversized motor (crenger.com).
Shutdown is the mirror image. The booster speed is eased down so feed pressure coasts. A soft‑stop on the HPP prevents rapid drops — uncontrolled, pressure fell 60→40 bar in 3 s; with soft‑stop, it slowed to ~1 bar/s (crenger.com). Controls typically open recirculation paths to flush membranes and prevent dry‑out. Some designs include an intermediate “turbocharger” mode: if a downstream second‑pass or product line trips, the system circulates feed at reduced flow (~35–45%) with zero output, preserving pressure in the membrane loop and easing restart (crenger.com). Interlocks on tank levels, pump current, and safety trips stay active throughout.
These start/stop sequences are commonly validated in dynamic simulations — modeling pump curves, motor torque profiles, ERD maps, piping resistances, membrane performance, etc. — to keep all components within safe envelopes (crenger.com). In practice, well‑tuned control using VFDs and soft‑starts instead of brute valves eliminates cavitation, reduces electrical stress, and protects membranes (crenger.com, crenger.com).
Measured outcomes and ROI signals
The engineering takeaway is quantifiable. Every bar of head saved in piping cuts ~0.07–0.08 kWh per m³ (researchgate.net). Poor piping design pushes pump sizes up and wastes energy in throttling. Intelligent start/stop control reduces downtime and membrane wear; soft‑start costs (~15–30% of motor) are smaller than premature membrane replacement or lost production (crenger.com). For control and instrumentation teams, the operating target is to keep all transition ramps within vendor limits (≤0.7 bar/s) and to model/predict each scenario — yielding reduced energy per m³, fewer pressure spikes, and longer asset life.
Source data and documented practices
Choi et al. (2020) analyzed a Korean SWRO plant and reported ~4–8 bar total high‑pressure piping loss (0.11–0.22 kWh/m³) and showed that modest pipe upsizing can cut losses by ~1.08–1.16 bar (researchgate.net, researchgate.net). Plant operators (e.g., Palmachim SWRO) have documented valve‑less startup schemes with VFDs and soft‑starters that respect ~0.7 bar/s membrane ramp limits (crenger.com, crenger.com). Manufacturer data on smart ERDs, including Danfoss’s MPE 70, highlight the value of integrating motor control to avoid overspeed (danfoss.com).
