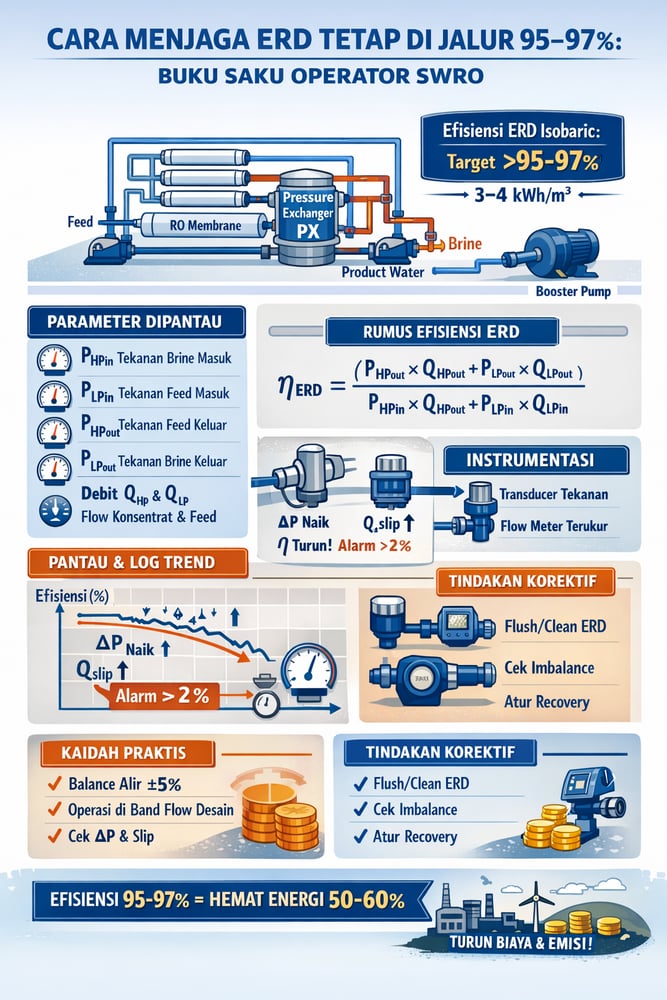
Isobaric energy‑recovery devices in seawater reverse osmosis now top 95% efficiency and have pushed plant energy use down to roughly 3–4 kWh/m³ — but only if operators keep them at their best efficiency point.
Modern seawater RO (SWRO) plants live or die by their energy‑recovery devices (ERDs). Isobaric ERDs — pressure exchangers (PX), which directly transfer concentrate pressure to the feed — now dominate new designs, with field surveys reporting efficiencies in excess of 95% (slideshare.net) (mdpi.com).
The payoff is visible in specific energy consumption (SEC): state‑of‑the‑art plants run at roughly 3–4 kWh/m³, versus about 6 kWh/m³ for conventional seawater RO without ERDs — a ~50–60% drop (sciencedirect.com). The theoretical minimum at 50% recovery is ≈1.1 kWh/m³ (sciencedirect.com), and ERDs have pushed modern plants near that benchmark.
Because ERDs account for 40–60% of SWRO energy savings, operators treat ERD performance as a core KPI. Targets are >95% for isobaric PX, with Energy Recovery’s high‑pressure PX Q units at ~97% peak efficiency (mdpi.com). Deviations below design efficiency prompt investigation.
ERD pressure and flow monitoring
ERD (energy‑recovery device) performance is quantified with pressures and flows at each port. For a standard PX (pressure exchanger), the essential signals are:
- High‑pressure (HP) inlet pressure, P_HPin (concentrate/brine entering the ERD).
- Low‑pressure (LP) inlet pressure, P_LPin (feed entering the ERD).
- HP outlet pressure, P_HPout (feed after the ERD, ideally near P_HPin minus minor losses).
- LP outlet pressure, P_LPout (brine after the ERD, typically to drain).
- Flow rates, Q_HP and Q_LP (volumetric brine and feed flows through the ERD).
- Differentials: ΔP_H = P_HPin – P_HPout and ΔP_L = P_LPout – P_LPin.
Pressure × flow gives power; for example, 50 bar on 100 m³/h is about 1.39 MW (50 bar = 5 MPa; 5 MPa × (100 m³/h)/3600 ≈ 0.139 MW). Comparing input vs. output pressure × flow yields recovered energy.
Instrumentation in practice includes high‑accuracy pressure transducers on each ERD port and calibrated flow meters on feed and concentrate lines. Differential‑pressure gauges across membranes or pumps contextualize ERD data, since membrane fouling (elevated RO ΔP) indirectly affects ERD performance by shifting flows. Supporting components are typically part of water‑treatment ancillaries.
Manufacturers advise balanced flows for best performance: HP concentrate flow should match LP feed flow within ~5% (manualslib.com). Operators use brine throttles or parallel units to hold that balance; off‑design flows increase slip or turbulent losses. A typical large PX Q400 operates from ~20–400 gpm; flows below that are not recommended (manualslib.com).
Key parameters to track continuously: P_HPin, P_LPin, P_HPout, P_LPout, Q_HP, Q_LP; optionally, rotor speed (for turbine‑style devices) and booster pump power. Trending these via SCADA lets teams compute “instantaneous” efficiency and detect anomalies (rising ΔP, flow mismatch).
Efficiency calculation method
ERD efficiency (η_ERD) is the ratio of recovered to available hydraulic power. Using consistent units (e.g., MPa and m³/s): η_ERD = (P_HPout × Q_HPout + P_LPout × Q_LPout) / (P_HPin × Q_HPin + P_LPin × Q_LPin) (mdpi.com). Inputs are P and Q on each port; outputs are the pressurized streams leaving the ERD.
Since Q_HPin ≈ Q_HPout (brine in vs. feed out) and Q_LPin ≈ Q_LPout (feed in vs. brine out) aside from small slip, the result often approximates the fraction of pressure transferred. For SWRO PX units where P_HPin and Q_HPin dominate, operators sometimes approximate η as (P_HPout – P_LPin)/(P_HPin – P_LPin), with flow‑ratio corrections.
Example: with brine (HP in) at 50 bar, feed inlet at 10 bar, and ERD feed (HP out) at 48 bar, and equal flows, η ≈ (48–10)/(50–10) ≈ 95%. If P_HPout falls to 47 bar at the same P_HPin, η ≈ 94%.
Beyond η_ERD, teams track: (a) power loss ΔP_Loss = (P_HPin×Q_HPin + P_LPin×Q_LPin) – (P_HPout×Q_HPout + P_LPout×Q_LPout), which becomes heat/turbulence; and (b) slip flow, Q_slip ≈ Q_LPout – Q_HPin for PX, typically 1–3% at design flow, where growth signals wear or imbalance.
OEM performance curves link flow, pressure, and efficiency (manualslib.com). At design flow, PX units run near peak efficiency; below design, slip losses rise sharply; above design, mixing/friction losses increase. Rule‑of‑thumb: for isobaric ERDs, leakage/slip dominates at low flows and frictional losses at high flows (mdpi.com) (mdpi.com).
Empirically, a study of a reciprocating‑isobaric ERD found slip dominant below ~30 m³/h (≈60% of rated), with pressure losses taking over above rated flow (mdpi.com). Parametric curves show, for example, PX model efficiency might fall ~1% per ~1.3 bar extra pressure slip (mdpi.com).
Instrumentation and data analysis
Sensor setup: place pressure transmitters (a) on the concentrate line before the ERD, (b) on the feed line at ERD inlet, (c) on the feed after the ERD (HP side), and (d) on the brine after the ERD (LP side). Fit flow meters on concentrate and/or feed inputs; secondary transducers can check booster pump discharge. Record frequently via SCADA. Reverse osmosis train coordination is typically part of integrated membrane systems oversight.
Data logging: compute instantaneous η_ERD; trend efficiency, ΔP across the ERD (including P_HPin – P_HPout), and slip percentage. Sudden drops in η or spikes in ΔP hint at fouling, cavitation, or imbalance.
Cost signal: if η_ERD drifts from 96% to 94% over months, that 2‑point drop means ~2% more feed energy, or ~0.06 kWh/m³ at a 3 kWh/m³ baseline. In a 10,000 m³/d plant, 2% of 3 kWh/m³ is ~600 kWhr/d — over 200 MWh/year — equating to thousands of dollars.
Baselines and alarms: capture a “healthy” baseline soon after commissioning or maintenance; flag when η_ERD falls >2% below baseline. Avoid starving ERDs below 70–80% of design flow. Alarm if HP outlet pressure drops more than 0.5 bar relative to inlet (unexpected) or if HP/LP flow imbalance exceeds 5%.
Maintenance indicators: in theory PX units have no wearing parts; in practice, ceramic rotors can accumulate biofilm or scale. Rising pressure losses indicate contamination; the manual notes contaminated feed or brine raises ΔP and scales down η (manualslib.com). Excessive slip (>3–5%) suggests seal wear or incorrect flow. OEMs suggest flushing with clean water on extended shutdowns to prevent fouling (manualslib.com). A long‑term drop in η at constant conditions usually warrants ERD cleaning.
Best efficiency point (BEP) operation
BEP (best efficiency point) generally aligns with design flow and pressure. Operating near BEP maximizes recovered energy and minimizes losses.
- Balanced flows: keep HP and LP flows matched within ±5% (manualslib.com). In multi‑train systems, throttle bleed/brine or parallelize PX units so each handles an appropriate fraction. If recovery is changed, retune valves so the same fraction of concentrate goes through each ERD.
- Flow band limits: avoid running far below or above rated flow; Energy Recovery advises against operating outside allowable ranges (manualslib.com). If demand falls, consider taking one PX offline rather than running two at ~30% flow. At very high flow, be wary of gas cavitation; some setups include throttling valves or gas separators.
- Booster pump coordination: the downstream booster pump should maintain P_HPout near design. Variable‑frequency drives adjust pump speed as feed changes; some plants modulate the pump so the ERD lifts feed to within 1–2 bar of target membrane pressure.
- Recovery control: overall RO recovery affects ERD benefit. Higher recovery means less brine (lower ERD flow) and diminishing energy payback (slideshare.net). Many SWRO trains target ~45–50% recovery to maximize ERD gain; very high recovery (e.g., >80%) typically forgoes ERD use without re‑optimization (slideshare.net).
- System matching and adaptive control: adjust membrane staging or bypass valves so high‑recovery trains don’t overload or starve the ERD; ensure any recycled concentrate has sufficient pressure for the next ERD. Supervisory control can modulate ERD loading in real time; small flow tweaks can rebalance when salinity shifts. Rules of thumb (such as closing a concentrate recirculation valve if ERD efficiency drops) can be codified.
Field checks and adjustments
- Metric: ERD efficiency (η_ERD). Trend: 95.7% → 93.5% in one month. Likely cause: fouling/deposits on rotor, increased slip or ΔP. Action: inspect/clean ERD (flushing or chemical cleaning), check flow balance, evaluate seals.
- Metric: HP out pressure (P_HPout) below spec at fixed P_HPin. Trend: 1 bar drop vs. design with normal brine feed. Likely cause: rising ERD pressure drop (slip or blockage). Action: check flow balance, check for trapped air/gas, clean ERD.
- Metric: Flow imbalance (>5% HP vs. LP). Trend: brine flow >> feed flow to ERD. Likely cause: valve mis‑setting or one PX out of sync. Action: re‑balance via concentrate valve or bring another PX online.
- Metric: Recovery increase (e.g., +10%). Trend: less brine ⇒ less ERD flow; efficiency drop. Likely cause: recovery set above initial design. Action: re‑tune flow controllers or adjust recovery setpoint.
Measured outcomes and global trends
With η_ERD ≈96–97%, base SEC drops by ~50% vs. no ERD. For example, a 100,000 m³/d plant might use ~1.2 MW with ERDs vs. ~2.4 MW without. A 1% loss in ERD efficiency raises SEC by ~0.03 kWh/m³; for 100,000 m³/d, that’s ~3000 kWh/day (≈1.1 GWh/yr) of extra pump electricity, equating to ~500 tons CO₂ work. Flow‑efficiency curves over weeks show a plateau near design and declines at the ends; if today’s curve shifts downward (say at 80% of last month’s η), investigate soon.
Globally, large SWRO plants commissioned in the 2010s average ~3 kWh/m³ SEC (sciencedirect.com) versus 4–5 kWh/m³ in the early 2000s. This drop is largely attributed to isobaric ERDs (sciencedirect.com) (slideshare.net). Indonesian plants should follow suit to meet efficiency goals. (For reference, Indonesian energy policy encourages industrial energy efficiency, so optimizing ERDs aligns with national targets.)
Business impact: each percentage point of ERD efficiency maintained saves energy and carbon. Improving η_ERD from 95% to 96% in a 50,000 m³/d plant can save ~1.5–2 res kW (peak) continuously, equating to ~$10–20K/year depending on local electricity rates. Over a decade, such gains can justify ERD maintenance costs.
Summary and sources
A robust ERD program uses precise pressure/flow measurements and regular trending to compute efficiency. Keeping flows within 5% balance (manualslib.com), staying in design flow bands, and addressing efficiency dips quickly maintains 95–97% efficiencies (slideshare.net) (mdpi.com), preserving the energy and cost savings that make SWRO viable.
Sources: industry surveys and reviews of SWRO performance (sciencedirect.com) (slideshare.net), ERD design literature (mdpi.com) (mdpi.com), and manufacturer documentation (manualslib.com).
