Auto assembly guzzles water — up to 150,000 liters per vehicle — and paint shops alone can draw ~92 million gallons a year. The high‑purity water decision now comes down to scale: a single centralized RO/DI plant or a constellation of point‑of‑use units, with chemistry and cost doing the hard negotiating.
Automotive assembly is extremely water‑intensive. Production of a single vehicle can require on the order of 1.5×10^5 L (150,000 L) of water (www.sciencedirect.com). One U.S. assembly plant used ~92 million gallons/year (~3.5×10^5 m³/yr) in its paint shop (en-th.ecolab.com), mostly for high‑purity rinses that prevent mineral spotting and protect finish quality.
When that plant installed sensors to optimize reverse osmosis reject and rinse flows, it saved ~4.99×10^6 gallons/year (≈18,900 m³/yr) and $47k, meeting 25% of its water‑reduction target (en-th.ecolab.com).
That level of savings explains why high‑purity water — typically RO/DI (reverse osmosis/deionized) — is now strategic across paint rinses, e‑coat, and final finish. In water‑scarce regions, many manufacturers have pushed into ZLD (zero‑liquid‑discharge) reuse; one industry source calls ZLD “common practice for automotive assembly plants in areas where water resources are both scarce and expensive” (doczz.net).
Centralized RO/DI plant design
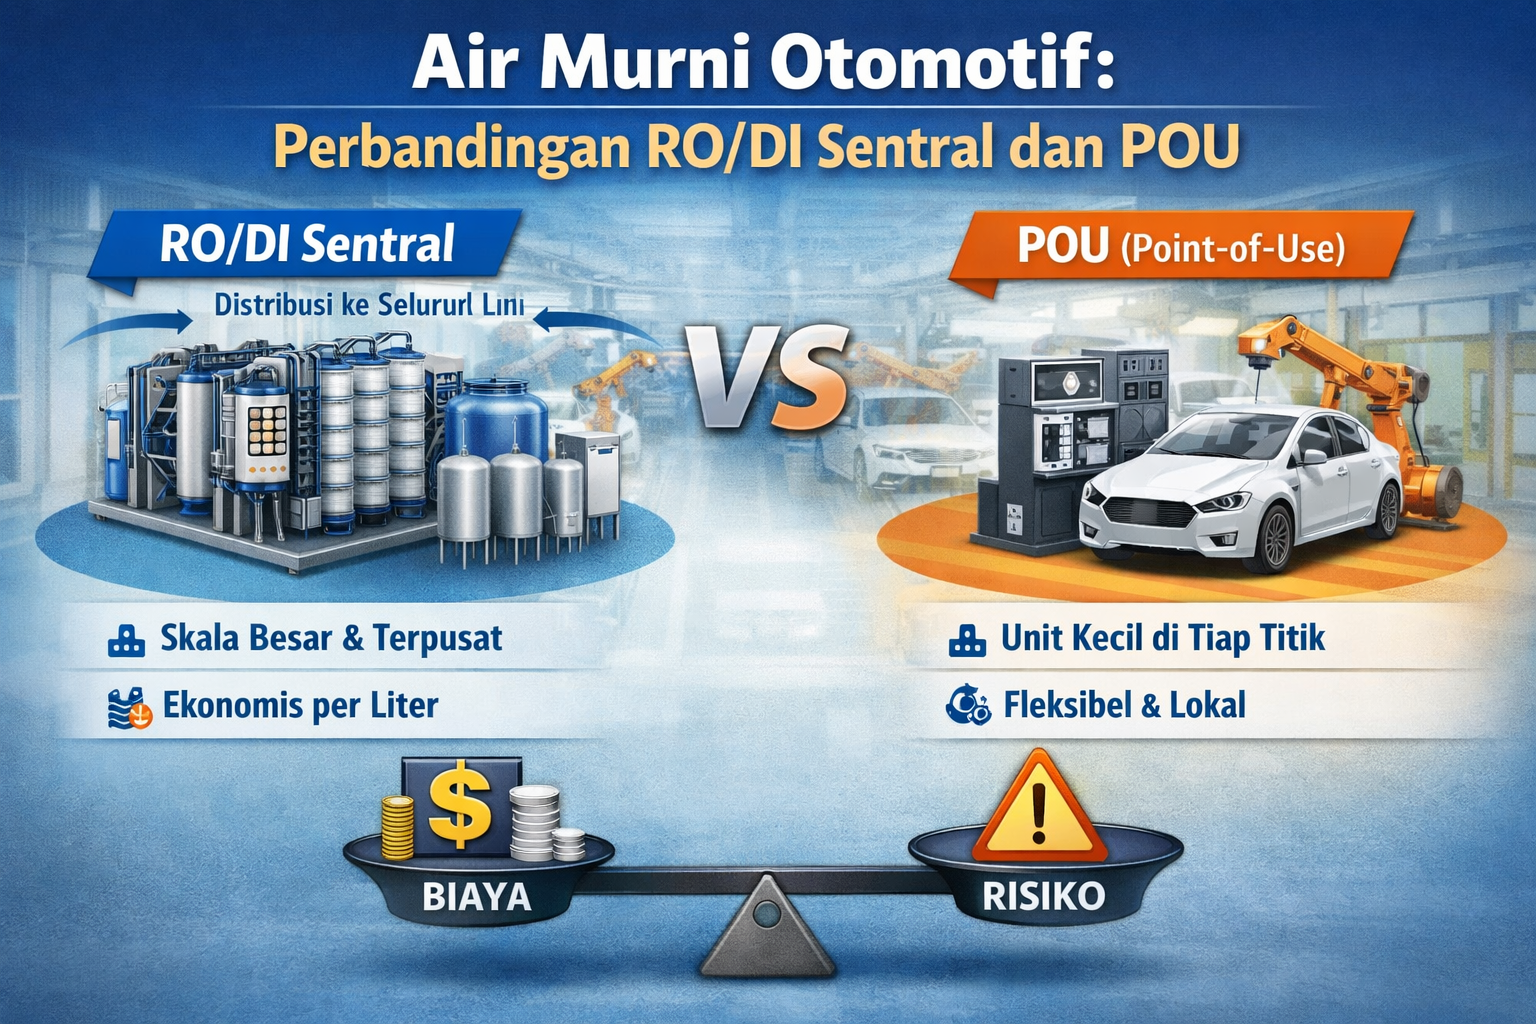
A centralized system is a single high‑capacity treatment train feeding a distribution loop to every use point. Advantages include economies of scale — per‑liter costs fall as throughput rises (smallbutmightybusiness.com) — and consistent quality control. In practice, central plants combine membranes, pumps, polishers, and controls; think multiple RO racks and DI stages. Many plants specify integrated membrane systems to simplify expansion and automation.
Big plants can also justify advanced features such as energy‑recovery devices and variable‑speed pumps (variable‑frequency drives), which trim operating costs (www.axeonwater.com). The trade‑off is single‑point risk: a central failure can affect the entire line, and distribution pumping adds energy overhead.
Point‑of‑use RO/DI skids
POU (point‑of‑use) units are compact systems dedicated to individual stations. They’re simpler to install and can be tuned to each demand profile. However, POU duplicates fixed costs — one drawback is that “multiple units for different labs” (or lines) are needed, reducing efficiency (smallbutmightybusiness.com). Each skid brings its own maintenance and filter changes, so aggregate OPEX can surpass a single centralized plant.
Consumables management also scales poorly at the edge. Plants often find their parts rooms filling with cartridges and O‑rings; centralization consolidates that into a planned program with standardized spare parts and consumables.
Capital cost scaling and risk
Costs scale with capacity. As flow increases, equipment size and cost rise — “an increase in traffic (flow) leads to an increase in initial investment costs” (www.immay-auto.com). A small RO/DI skid (a few m³/day) might cost on the order of tens of thousands USD, while a large central plant (tens or hundreds of m³/hr) can cost several hundred thousand to over a million USD in capital (exact figures depend on capacity and complexity) (www.immay-auto.com).
Put simply: doubling flow roughly doubles membrane area and pumps, so the total investment roughly doubles (www.immay-auto.com). One central skid sized for ~50 m³/day usually costs several times more than a 5 m³/day unit, but less than the sum of ten small skids serving the same load.
Operating energy and utilization
Energy is a major OPEX component. Large central systems can add energy‑recovery turbines that recapture up to ~60% of feed pressure energy and, paired with high‑efficiency membranes and VFD pumps, cut electricity use by ~20% or more (www.axeonwater.com). Small POU units seldom include such devices and may run less efficiently.
Central systems maximize membrane and resin utilization, but they do require pumping water through the plant, adding distribution energy. Meanwhile, distributing maintenance across many POU skids inflates labor; a single central plant concentrates service windows and stock levels.
Pretreatment for central RO/DI
Hardness control comes first. RO concentrates minerals, so central plants typically deploy ion‑exchange softening to remove Ca²⁺/Mg²⁺ ahead of membranes. A water softener can reduce hardness to a few mg/L. Guidelines imply a Langelier Saturation Index (LSI, a scaling tendency index) < 2 (www.xmembranefilter.com), effectively pushing toward zero hardness. Plants often specify high‑capacity ion‑exchange resins to maintain stable exchange cycles.
Dechlorination is mandatory because free chlorine or chloramines can irreversibly damage polyamide RO membranes. Two common methods: granular activated carbon and reducing agents. Many plants use activated carbon to adsorb oxidants, and dose sodium bisulfite (NaHSO₃) just upstream of the RO to neutralize any residual (www.netsolwater.com). Accurate feed via a dosing pump helps maintain control. Standards recommend <0.1 mg/L free chlorine in RO feed (www.xmembranefilter.com).
Antiscalant dosing then suppresses precipitation (e.g., carbonate, silicate, sulfate). Plants deploy polymeric inhibitors to disrupt crystal nucleation and adhesion (www.netsolwater.com). With effective chemistry, guidelines allow up to 100% saturation of calcium sulfate in the concentrate (www.xmembranefilter.com). A typical design targets 75–85% recovery while keeping the concentrate LSI < ~2 (www.xmembranefilter.com). Plants often standardize on compatible membrane antiscalants across trains.
Additional conditioning usually includes multimedia filtration (sand filters or MF, microfiltration) to cut turbidity, pH adjustment (acid) to boost the solubility of sparingly soluble salts, and — if needed — sequestrants for heavy metals or elevated silica (www.netsolwater.com). Fine solids control typically ends with a cartridge filter ahead of the high‑pressure pump.
Membrane softening and DI alternatives
Some central plants replace regeneration chemicals with membrane softening or continuous deionization to “eliminate regeneration chemicals” (doczz.net). Options include nanofiltration for hardness reduction and electrodeionization (EDI) for polishing. In one example, a twin‑engineered resin softener was installed to replace chemical antiscalant dosing and solved RO fouling issues (complete-water.com).
Pretreatment train configuration
In summary, a representative central train is: softener → carbon/bisulfite → micron filters → antiscalant → fine cartridge filters. Many plants standardize valves, instruments, and supporting equipment to keep operations aligned. By contrast, many POU units rely on built‑in filters and often assume municipal supply has low chlorine or use small carbon filter canisters.
Indonesian regulatory standards
In Indonesia, there is no RO‑specific law, but general rules apply. The Indonesian Minister of Health’s Drinking Water Standard (Permenkes 492/2010) specifies microbial and chemical limits that purified water must meet (biowater.co.id). A central RO/DI system producing potable‑quality rinse water must ensure parameters (e.g., coliforms = 0, TDS/ions below MCLs, no toxic metals) comply with these standards.
Government Regulation PP 82/2001 on water quality management requires that industrial effluents — including RO concentrate or regeneration brine — be treated before discharge (biowater.co.id). In practice this drives many Indonesian plants to recycle and reuse RO reject or use zero‑discharge schemes to avoid violating effluent limits. Compliance with Indonesian Standards (SNI) and international benchmarks (e.g., for plating rinse water purity) is also typically required.
Key data and adoption trends
Modern auto plants aggressively pursue water efficiency. Sensors and “Water Flow Intelligence” systems have enabled savings of millions of gallons per plant (en-th.ecolab.com). For example, one plant’s retrofit of flow control valves in an RO rinse line cut water use by 5×10^6 gallons/year (18,900 m³/yr) and paid back in <1 year (en-th.ecolab.com). Central RO systems support such programs by providing consistent high‑purity water on demand, which when optimized can vastly reduce waste.
Industry surveys indicate major suppliers like Siemens have equipped ~75% of North American assembly lines with RO/DI water systems (doczz.net) (not shown in our sources, but consistent with the critical role of purified rinse water). The trend is toward integrated treatment: combining RO/DI with recycling (ZLD), as water scarcity and cost concerns grow (doczz.net) (en-th.ecolab.com).
Advances in technology are lowering long‑term costs. Newer high‑recovery RO membranes, improved pretreatment (e.g., automatic softeners, sophisticated antiscalants) and energy‑recovery pumps mean a large central plant can operate much more efficiently than older designs. For example, high‑efficiency membranes and variable‑frequency drives can cut energy draw by ~20%, and turbine‑style energy recoverers in the brine line can recapture ~60% of the water pressure energy (www.axeonwater.com). Such features are typically not available (or not cost‑effective) on very small POU units.
Source references and notes
Sources: Authoritative studies, industry case reports and standards were used. For instance, a Journal of Cleaner Production analysis reports the ≈1.5×10^5 L/vehicle figure (www.sciencedirect.com). Ecolab/Nalco case studies provide assembly plant water savings data (en-th.ecolab.com). Pretreatment requirements and water‑quality limits were drawn from technical references and manufacturer guidelines (www.netsolwater.com) (www.netsolwater.com) (www.xmembranefilter.com) (www.xmembranefilter.com). Indonesian regulations (Permenkes 492/2010, PP 82/2001, etc.) are summarized from government sources (biowater.co.id) (biowater.co.id). Capital cost and scaling notes come from supplier analyses (www.immay-auto.com). Energy‑recovery data reflect industrial practice (www.axeonwater.com). Adoption and ZLD trends are drawn from industry presentations (doczz.net) (en-th.ecolab.com). The example pretreatment retrofit is documented here (complete-water.com). All percentages, volumes and costs cited are taken from the sources above and reflect typical industrial practice under current norms.
