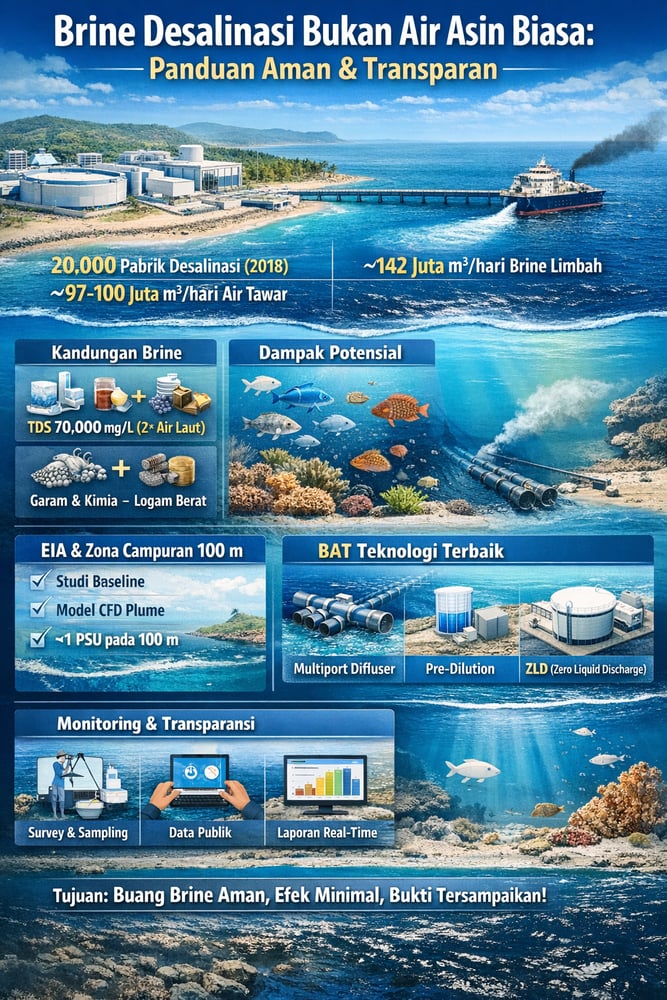
With ~20,000 plants now producing ~97–100×10^6 m^3/day of water, desalination’s footprint is clear — and so is its brine. Developers are learning that credibility on brine disposal comes from thorough environmental impact assessments and best-available technology, translated into plain, verifiable numbers.
Desalination is growing rapidly: by 2018 there were ~20,000 desalination plants globally, producing ~97–100×10^6 m^3/day of freshwater (informedinfrastructure.com) (www.sciencedirect.com).
This creates even more brine: a hypersaline effluent (i.e., saltier-than-seawater discharge) typically at 1.5–2.0× the salinity of seawater (www.intechopen.com) (www.lenntech.com.tr). In aggregate, about 142×10^6 m^3/day of brine is discharged worldwide (www.sciencedirect.com).
Brine carries not only excess salt but residual treatment chemicals and trace metals, posing risks of local salinity spikes, oxygen depletion and toxicity (including eutrophication, pH shifts, and heavy‑metal pollution) in coastal waters (www.sciencedirect.com) (www.intechopen.com). For example, seawater reverse osmosis (SWRO) reject typically has ~2× ocean salinity and elevated anti‑scalants or corrosion products (www.intechopen.com). Without mitigation, dense brine sinks and forms a concentrated plume that can impact benthic (seafloor) communities.
These facts underscore that communicating actual volumes and constituents — e.g., “Our 4,500 m^3/d SWRO plant will produce ~4,500 m^3/d of brine at ~70,000 mg/L TDS (total dissolved solids; about 2× seawater)” (www.researchgate.net) (www.intechopen.com) — is crucial for transparency. That transparency sits alongside the core treatment train, from pretreatment such as ultrafiltration (UF) pretreatment to high‑pressure SWRO systems and integrated membrane systems.
Regulatory benchmarks and mixing zones
In most jurisdictions, brine disposal is treated as a significant environmental issue. New desalination projects typically require a thorough Environmental Impact Assessment (EIA; a formal evaluation of potential environmental effects) that specifically addresses brine discharge plans — outfall location, mixing, compliance, and ecosystem effects (www.researchgate.net) (www.sciencedirect.com).
For example, an Indonesian SWRO project report explicitly notes that an EIA “is required to address discharging brine water, outlet placement, and all downstream issues… impacting marine biota, fishery, [etc.]” (www.researchgate.net).
Many international guidelines recommend strict mixing criteria: for instance, keeping salinity increases below 5% (or 1 PSU, practical salinity units) outside a typical 100 m mixing zone (www.researchgate.net). Jenkins et al. (2012) found that limiting a brine plume to ~2–3 g/kg above ambient at 100 m is considered a moderate impact (www.researchgate.net).
Communicating these benchmarks — for instance, “our diffuser is designed so the salinity at 100 m is <1 PSU above background (well under the 5% guideline)” — helps regulators and the public evaluate compliance. Agencies may also impose numeric water‑quality limits (Indonesia’s marine water‑class standards, CAC (2003) etc.) for nutrients, metals, and biological oxygen demand on any discharge. Developers should cite or exceed such standards explicitly, e.g., “monitored heavy metals will be <10% of national limit.”
Robust EIAs and plume modelling
A thorough EIA is the primary tool for quantifying brine impacts and building stakeholder trust. Baseline studies should measure local seawater temperature, salinity, currents, and biology (fish, corals, plankton) and then model worst‑case brine plumes and dilution under seasonal conditions.
Future‑sizing and mixing modelling — using CFD (computational fluid dynamics) or EPA’s Visual Plumes — allows developers to show predicted salinity and chemical profiles and demonstrate compliance, for example keeping post‑discharge salinity <5% above ambient at the edge of a 100 m mixing zone (www.researchgate.net).
Impact quantification translates chemical changes into ecological risk — for example, “modeled 5‑spot salinity increase translates to <2% decrease in coral growth rate” with literature references — noting that salinity rises of 2–3 g/L can stress marine invertebrates (www.sciencedirect.com). Include heavy metals (often concentrated in reject) relative to sediment toxicity benchmarks.
Alternatives and mitigation should be documented — land discharge vs. pipeline vs. combined ocean outfall — along with the chosen diffuser design and chemical minimization. A monitoring plan then specifies post‑construction surveys (e.g., quarterly salinity and biota checks) to verify model predictions. Public involvement matters: sharing draft EIA findings with local communities and regulators, with transparent maps and “before vs. after” charts, preempts misunderstandings. In short, present data — volumes, concentrations, dispersion distances — to show that any environmental change will be minimal or managed (www.researchgate.net) (www.sciencedirect.com).
Best‑available technology for outfalls
Saying you will use best‑available technology (BAT) is credible only when data proves it. For brine outfalls, that centers on optimized diffuser systems and dilution strategies. In shallow tropical waters, multiple‑jet diffusers achieve far greater initial mixing than a single jet (www.intechopen.com). An MIT study found multiport diffusers “are better suited than single jets at locations with a mild bottom slope” (www.intechopen.com). Frame it plainly: “We will install a multiport diffuser with X‑ports, designed using Froude‑jet models, to achieve >10× dilution in the first 20 m.”
Pre‑dilution blending is another lever. For co‑located power/desal plants, mixing brine with plant cooling water is a proven strategy (www.intechopen.com). An engineering study notes pre‑dilution with treated wastewater “is shown to reduce outfall cost”, whereas just adding seawater or concentrating brine increases costs (www.intechopen.com). In practical terms, combining brine with an available effluent reduces salt concentration immediately and can eliminate the need for dual outfalls (www.intechopen.com). For example: “blending 50% treated wastewater cuts brine salinity by half, doubling volume but lowering density and toxicity.” Treated effluent from on‑site membrane bioreactors MBR can serve this role within an integrated plant.
Zero Liquid Discharge (ZLD; systems using concentrators/crystallizers to eliminate liquid waste) is a different approach. ZLD can eliminate liquid waste, recovering fresh water and salt (www.sciencedirect.com). The cost is significant: “Though full ZLD is expensive (high capital/operating costs)” (www.sciencedirect.com). Even when not selected, evaluating partial crystallization or seasonal storage conveys seriousness.
Optimized operation also matters. Commit to minimizing chemicals (using biodegradable anti‑scalants), operating at the highest practical recovery (e.g., 50–55% SWRO yield, reducing brine volume) and using energy‑recovery devices (www.lenntech.com.tr). Each measure can be quantified: “we achieve 55% recovery, so only ~45% of feed becomes brine” (www.lenntech.com.tr). On the chemical side, low‑dose formulations such as membrane anti‑scalants for membranes, metered by a precise dosing pump, help lower residuals at the outfall. Upstream, ultrafiltration pretreatment can reduce fouling tendency, supporting lower chemical use across the RO train.
Monitoring plans and adaptive management
Effective communication isn’t just pre‑startup; it continues during operation. A rigorous monitoring program with publicly reported results signals accountability. For example: “Monthly salinity and DO (dissolved oxygen) profiles will be measured at 0, 50 and 100 m from the outfall; we will publish these reports on our website.” If measurements show any exceedance, adaptive measures should follow — for instance, adjusting diffuser orientation or flow.
Referencing international practice helps: the US and Australia often require permitted mixing zones with regular monitoring. Comparing ongoing data to the baseline demonstrates measured impacts stay within model predictions. Data transparency reduces risk: permit no surprises. Early detection avoids fines or shutdowns, which is cost‑saving in the long run.
Openness can become a strength. A developer might later note, “Within one year of operation, we achieved 300× dilution on average at 100 m,” using the same monitoring stations to verify diffuser performance.
Public communication and measurable assurances
Communities ask hard questions about brine and marine life, a point underscored by the WateReuse public communication toolkit (watereuse.org). Visuals and analogies help explain dilution, such as describing a diffuser dissipating brine to ocean‑like salinity within defined meters, akin to adding a small amount of salt to a large bathtub — quickly imperceptible. Findings and conclusions emphasize facts, simple language and local context to “shorten the learning curve” (watereuse.org).
Measurable assurances build confidence: “max salinity +1 PSU at 50 m, <0.5 PSU at 100 m — i.e., within ecological variation” (www.researchgate.net). Comparative data helps too: “Study of a similar SWRO plant in [Region] showed <3% salinity rise within 50 m with similar diffusers” (www.researchgate.net).
FAQs and fact sheets clarify common concerns — “Will fish die?” or “Is this salt safe?” — by emphasizing that heavy metals are low, water‑quality standards are met, and real impacts are localized and transient, backed by EIA modelling and field data. Town halls or site visits, ideally with independent scientists presenting EIA findings, support trust. An open data portal where regulators and NGOs can view monitoring and annual reports adds further transparency.
Context matters too. The need for desalination is often acute: “funding was approved after educating stakeholders that Batu Hijau’s water demand outstrips groundwater by 50%” (www.researchgate.net). Globally, brine disposal is a known challenge (www.sciencedirect.com) (www.sciencedirect.com), and applying the latest solutions — multiport diffusers and high‑recovery systems — is both expected by regulators and seen by well‑informed communities as an acceptable trade‑off for sustainable supply.
Bottom‑line communication framework
A developer’s communications must be anchored in data and compliance. Quantify everything (volumes, concentrations, distances, recovery rates) and tie them to standards. Cite authoritative benchmarks (e.g., 100 m mixing zones, EIA laws, water‑quality limits). Demonstrate costs and benefits: for example, “pre‑dilution cut outfall capital by X%” (www.intechopen.com). By walking regulators through the same hard numbers engineers use — and translating them into plain assurances for the public — developers build credibility. In essence: show, don’t just tell. When every claim (“minimal impact,” “BAT applied,” “below thresholds”) is backed by a study or regulation (www.researchgate.net) (www.sciencedirect.com) (www.sciencedirect.com) (www.intechopen.com), decision‑makers and communities can accept projects with confidence.
Sources: Authoritative industry and scientific publications (peer‑reviewed articles, international agency reports, engineering studies) and regulatory documents were used for all data. Full references are provided inline (www.sciencedirect.com) (www.researchgate.net) (www.sciencedirect.com) (www.intechopen.com) (www.sciencedirect.com) (www.intechopen.com) (www.researchgate.net) (watereuse.org) (informedinfrastructure.com) (www.lenntech.com.tr).
