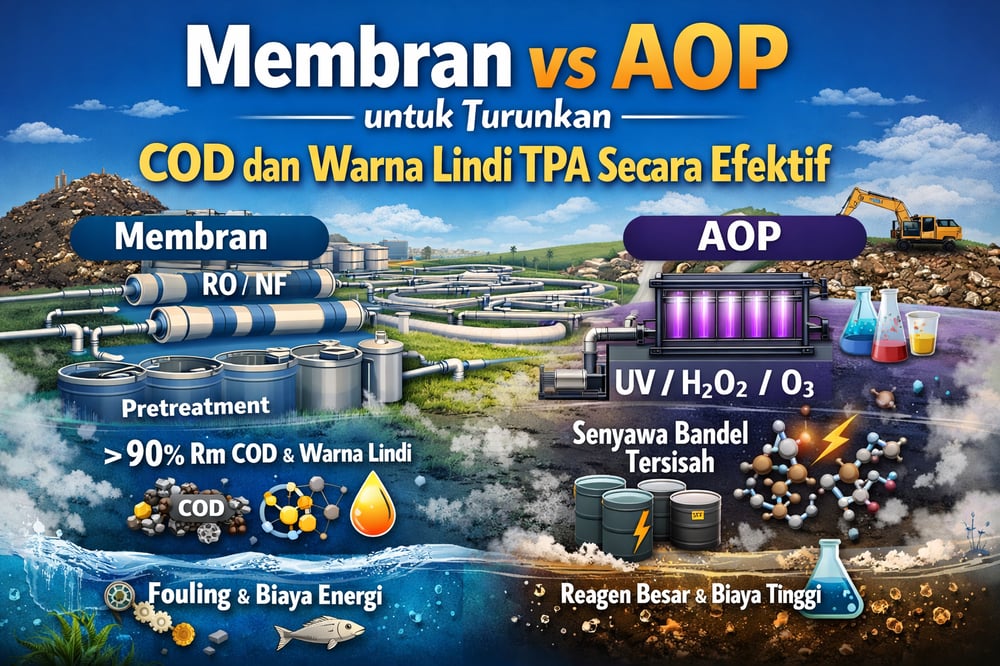
Nanofiltration and reverse osmosis can strip 90–99.5% of organics and virtually all color from landfill leachate, with advanced oxidation pushing even further — but membrane fouling and high OPEX remain the hard limit, studies show.
Landfill leachate is the industry’s toughest wastewater: dark, salty, and stubbornly loaded with organics. In mature leachates, reverse osmosis (RO) routinely removes 95–99.5% of chemical oxygen demand (COD, a proxy for oxidizable organics), with one review noting RO after biological treatment achieved up to 99.5% COD and ~100% ammonium retention (www.mdpi.com) (www.mdpi.com).
Nanofiltration (NF, a pressure-driven membrane with ~1–2 nm pores) typically trails RO but still clocks ~80–90% COD removal while knocking down color from humic substances — especially when paired with an oxidation step (www.mdpi.com). In bench tests, an NF+RO scheme posted COD rejections of 87–96% (www.mdpi.com).
Membrane filtration outcomes (NF/RO)
Plants rarely run a single barrier. Instead, they stage pretreatment and tight membranes: think ultrafiltration (UF) or a membrane bioreactor (MBR) feeding NF and then RO. One full-scale MBR pretreatment plant removed 75% of total COD before a UF post-filter polished the water (www.mdpi.com). When RO follows any biological step, retention generally rises to ~95–99% (www.mdpi.com) (www.mdpi.com).
Operators increasingly specify dedicated nanofiltration skids to soften the load on RO; NF rejects multivalent ions and large organics that carry color, leaving mainly low‑molecular species (e.g., fulvic acids) in the permeate (www.mdpi.com). In practice, NF’s role as a guard stage has made nanofiltration a common bridge to tight desalting.
RO still does the heavy lifting on dissolved organics and salts — the reason many leachate trains anchor around brackish-water RO units, often preceded by UF. To integrate multiple barrier types, plants adopt complete membrane systems designed for industrial wastewater duty.
Color removal and humic barriers
Leachate’s brown/black hue comes from humic substances. RO and NF largely block these UV‑absorbing molecules, and when a photo‑Fenton pretreatment (UV light + H₂O₂ + Fe²⁺) precedes RO, studies report >95% color removal alongside ~86% COD reduction (www.mdpi.com). More broadly, any advanced oxidation process (AOP) or membrane step that oxidizes or filters high‑molecular‑weight humics can achieve >90% decolorization (www.mdpi.com) (www.mdpi.com).
Upstream polishing with ultrafiltration helps stabilize downstream flux by skimming colloids before NF and RO, which also supports color control.
NF‑RO sequencing and energy trade‑offs
Sequence matters. Bench data favor NF→RO over RO→NF because NF’s lower pressure operation shields the RO stage; NF‑RO yielded higher overall flux and lower energy than RO‑NF while still surpassing >95% overall COD removal (www.mdpi.com) (pmc.ncbi.nlm.nih.gov). That’s why real plants combine pretreatment, then tight membranes, rather than betting on a single stage (www.mdpi.com).
Membrane fouling and cleaning burden
Leachate is a fouling cocktail: humic acids, colloids, high TSS/TDS, and oils drive rapid flux decline and even membrane damage. In microfiltration (MF) of raw leachate, one study measured ~43% COD removal, with fouling resistance accounting for ~32% of total flow resistance; pure‑water permeability plunged by 53% after a single run (www.researchgate.net). MBRs share the same Achilles’ heel: the “major drawback” is fouling, which triggers frequent cleaning and downtime (www.mdpi.com).
The mechanisms are familiar — pore blocking and gel layer formation — and they’re aggravated by colloidal humics and fats in leachate (www.researchgate.net) (www.researchgate.net). For leachate‑strength feeds, measured NF/RO fluxes often fall below 10 L·m⁻²·h⁻¹.
To manage clean‑in‑place cycles, some facilities add specialized membrane cleaning chemicals to their O&M playbook, alongside routine acid/caustic cleans noted in the literature.
Pretreatment steps and equipment
The consensus is unequivocal: every commercial MF/UF/NF/RO leachate system leans on extensive pretreatment — screening, settling, coagulation, granular activated carbon (GAC), and more — to strip foulants before tight membranes (www.mdpi.com) (www.mdpi.com). That often starts with coarse debris capture; many plants opt for an automatic screen, while others standardize on a manual screen for low‑load sites.
After solids control, chemical coagulation/flocculation precipitates colloids and humics. Operators dose metal salts or natural polymers; packaged coagulants and separate flocculants are common in these steps, typically managed by a metering skid with a dedicated dosing pump.
Clarification and floatation follow. Where footprint is tight, a lamella settler or a DAF unit is used in place of a conventional clarifier. Many designs add adsorption of residual organics on activated carbon before membranes to further deplete color precursors.
In practice, precipitation or electrocoagulation can remove >50% of COD and virtually all suspended solids, and a well‑tuned train (e.g., aerated equalization + chemical coagulation + UF) can cut fouling rates by 50% or more (www.mdpi.com).
When the load is stable, plants drop in an MBR block to tackle bulk organics; packaged membrane bioreactors are frequently paired with downstream NF/RO to deliver reuse‑quality permeate.
Operational energy and OPEX realities
Even with robust pretreatment, membranes demand frequent cleaning and eventual replacement. Energy use is high: a full‑scale leachate MBR (UF after nitrification) reported ~5.2 kWh per m³ of permeate, translating to ~€0.79/m³ — well above typical municipal WWTP costs (~0.5 €/m³) — largely due to pumping against high osmotic pressure and frequent backwashes (www.mdpi.com). In this calculus, OPEX is dominated by electricity and consumables (NaOH/acid for CIP, membrane modules).
Upstream polishing filters also matter: a simple sand filter or a high‑surface cartridge filter can extend runtime between CIP events by shaving off residual particulates.
AOP performance and cost profile
Advanced oxidation processes (AOPs — chemical/photochemical reactions that generate highly reactive radicals) target recalcitrant organics like humics and phenols that biology misses. In leachate service, AOPs usually follow biology or physical steps. A photo‑Fenton stage (UV light + H₂O₂ + Fe²⁺) applied to biologically pretreated leachate achieved ~86% COD reduction and >95% color removal (www.mdpi.com). Other AOP variants (UV/O₃, persulfate, electro‑Fenton) have oxidized >60–90% of remaining COD, depending on dose and contact time (www.mdpi.com) (www.mdpi.com).
Bench and pilot runs consistently show COD removals from ~50% up to >90%. In one case, UV+O₃ delivered 79–95% COD removal (higher with longer UV exposure), while UV/H₂O₂ ranged ~55–80% depending on dose (www.mdpi.com) (www.mdpi.com). Crucially, AOP can raise BOD/COD (biodegradability), enabling another biological polish.
On the ground, UV infrastructure is a common enabler; compact ultraviolet systems pair with oxidant dosing to form the photochemical core of many AOP skids.
AOP limitations and operating costs
The catch is cost and complexity. Photochemical AOPs carry high capital and treatment costs for leachate; turbidity and coloration cut UV effectiveness, forcing more lamps and cleaning. UV lamps also foul and lose output, requiring frequent replacement (www.mdpi.com). Electricity and chemicals dominate O&M: an industrial‑scale UV/H₂O₂ system might consume several kWh/m³ and kilograms of H₂O₂ per m³ of leachate.
Costs escalate further when targeting persistent pollutants. A techno‑economic survey notes AOP‑based PFAS treatment of leachate easily runs at >€1–24 per m³ (including destruction of concentrates) (foreverpollution.eu). Even without PFAS in scope, photo‑Fenton systems require very acidic pH (≈2–3) and generate iron sludge, adding to cost (www.mdpi.com). While AOP can cut COD by >80% within hours (www.mdpi.com), the reagent and energy burden is substantial.
Process integration and local standards
Because both NF/RO and AOP are resource‑intensive, most leachate plants combine steps: equalization/biological treatment, then coagulation/filtration, then membrane polishing (NF/RO), and sometimes AOP as a final polish. Each upstream barrier reduces the load — and volume — the most expensive step must handle.
In tropical countries like Indonesia, staging is essential. Indonesian regulations cap landfill leachate COD at 300 mg/L (Permen LHK No.59/2016) (legalcentric.com). Hitting that target often means >90% removal from raw leachate, prompting designs that pair a UASB (upflow anaerobic sludge blanket) or an MBR for BOD/NH₄ removal with chemical coagulation and NF/RO. Fouling control via robust pretreatment — and minimizing AOP dose (e.g., leveraging natural sunlight or UV‑LEDs to curb energy use) — are key design challenges.
Design trade‑offs and pilot validation
Three takeaways recur across studies. First, NF/RO can deliver the stringent COD/color removals demanded — up to ≈99% — but only with aggressive pretreatment to limit fouling (www.mdpi.com) (www.mdpi.com). Second, membrane OPEX is high in leachate service — for reference, a full‑scale plant logged ~5.2 kWh/m³ (~€0.79/m³) (www.mdpi.com). Third, AOPs degrade compounds impervious to biology but typically require large reagent and power inputs, making them best suited as final polishing (www.mdpi.com).
Most importantly, the technical trade‑off is explicit: capital and energy versus effluent quality. Data‑driven pilot testing — quantifying %COD removal, decolorization, and fouling rates under local leachate — is the only reliable basis to size pretreatment and forecast O&M costs. For those building out flexible capacity, containerized options, including rental units configured for SWRO‑style operation, can derisk early trials before full‑scale deployment.
Sources and further reading
Peer‑reviewed studies and regulatory data underpin this analysis. For example, Arkhangelsky et al. (2022) reviewed landfill AOP and membranes (www.mdpi.com) (www.mdpi.com), while Ramaswami, Behrendt, and Otterpohl (2018) compared NF‑RO vs RO‑NF. Coppini et al. (2018) documented full‑scale MBR performance (www.mdpi.com). Pertile et al. (2018) quantified MF fouling in raw leachate (www.researchgate.net). Indonesian discharge standards are set in Permen LHK No.59/2016 (legalcentric.com).
