Textile dyeing wastewater is a cocktail of high COD, stubborn color, salts, and metals — and regulators are tightening the screws. A multi‑barrier train of coagulation/flocculation, advanced oxidation, and membranes is the data‑backed route to compliance and reuse.
Textile dyeing effluent is typically extremely polluted, with organic loads measured as COD (chemical oxygen demand) in the hundreds to thousands of mg/L and hard‑to‑degrade azo/anthraquinone dyes driving intense color (hundreds to thousands of ADMI units; ADMI is a color unit metric) (www.mdpi.com). Suspended solids (TSS, total suspended solids) are high (tens to thousands mg/L) and the pH is often alkaline; salts (from salt‑fixing agents) and trace heavy metals (from dyes/mordants) add to the challenge.
Global textile processing uses more than 90 billion m³ of water per year, and dyeing alone generates a large fraction of industrial water pollution (www.planetcustodian.com) (www.planetcustodian.com). Physically, doughnut turbidity and color require treatment.
In Indonesia, Permen LHK P.16/2019 mandates that even small dye plants (<100 m³/d) must meet BOD≤60 mg/L, COD≤150 mg/L, TSS≤50 mg/L and true color ≤200 Pt‑Co (www.scribd.com). Larger plants have even tighter limits (www.scribd.com). Meeting such standards requires multi‑stage treatment supported by robust data‑driven design.
Front‑end screening and equalization
Before chemistry, operators stabilize flows and strip debris. Equalization balances pH and load; coarse debris is removed by primary screening systems. In many plants, automated screens provide continuous removal; an example is an automatic screen upstream of dosing and clarification. At this stage, packaged equipment for primary separation can be specified via wastewater physical separation modules.
Chemical coagulation and flocculation
The first high‑impact step is coagulation‑flocculation to remove colloidal solids and cut color. Coagulants such as alum, ferric chloride/sulfate, or polyaluminum chloride neutralize charges on dye colloids and precipitate organics; flocculant aids (e.g., polyacrylamide) build settleable flocs. Jar‑test optimization is used to set dosage and pH (often slightly basic) where removal peaks. Dosing accuracy matters, which is why plants pair coagulants with a dosing pump and industrial coagulants like PAC for wastewater or polymer flocculants.
Under optimal conditions, performance is striking. Daud et al. (2023) reported that alum at 1.5 g/L and pH≈8 on batik wastewater removed ~92% turbidity, ~88% color, ~70% COD and 100% of TSS (www.ncbi.nlm.nih.gov). Other studies report similar outcomes, often >80–90% TAAS Solid and color removal (www.ncbi.nlm.nih.gov). Ferric salts behave similarly; in some cases PAC achieved near 100% color removal at ~0.8 g/L dose (www.researchgate.net).
Complete COD removal via chemicals alone usually requires impractical doses, so this stage targets suspended colloids and dye molecules. Sludge generation is material (~10–50% of influent suspension volume) and requires settling or dewatering in a clarifier. Imported data show 90–100% TSS removal is routine (www.ncbi.nlm.nih.gov), with >80% color removal and COD reductions of 50–80%; turbidity often drops to <10 NTU.
Economics: coagulant cost runs from tens of cents to a few dollars per m³, depending on dose. Alum and FeCl₃ are inexpensive but produce metal‑rich sludge; advanced coagulants can improve efficiency. There is growing interest in “green” coagulants (e.g., Moringa, tannins) though data are limited. Overall, proper coagulation can cut solids load by ~90% and color by ~70–90%, easing downstream polishing (www.ncbi.nlm.nih.gov) (www.ncbi.nlm.nih.gov).
Biological oxidation backbone
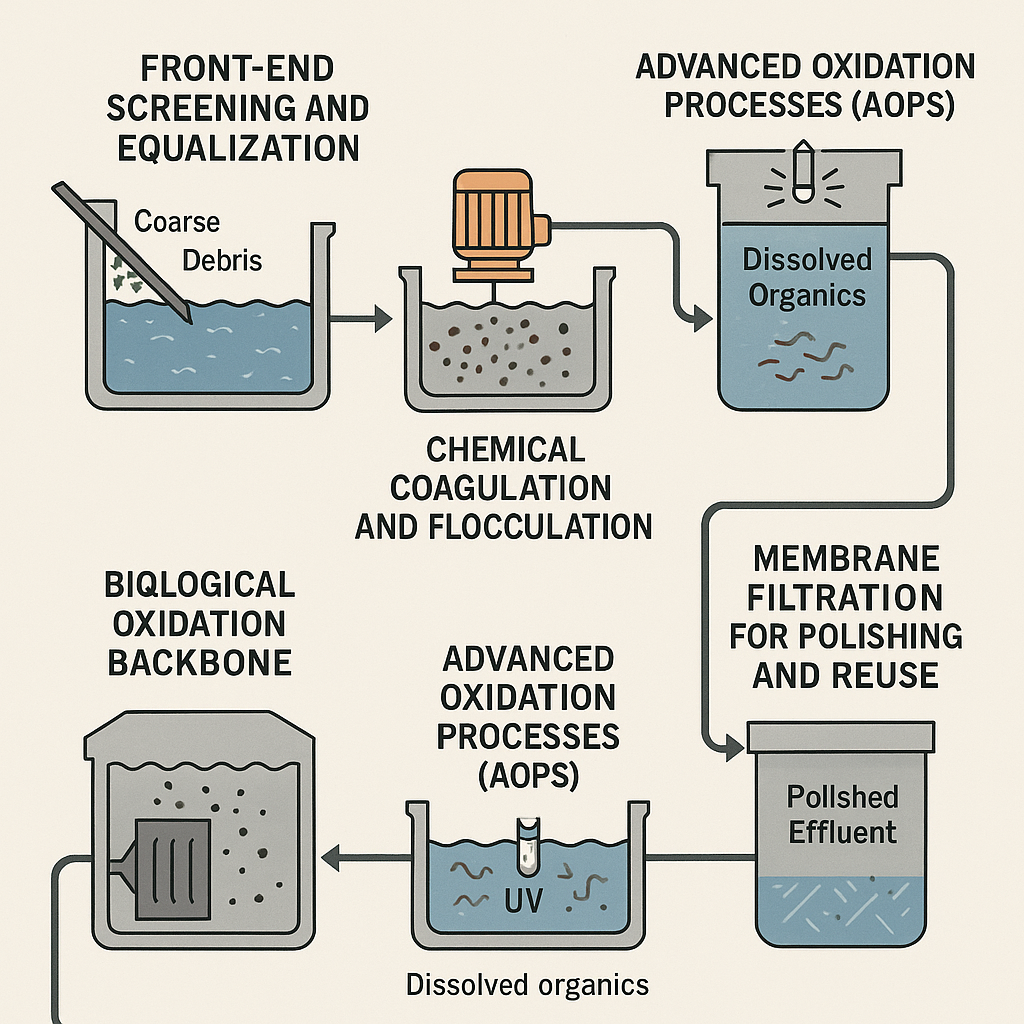
Biological treatment removes the bulk biodegradable load before polishing. Aerated activated sludge or membrane bioreactors (MBR) typically remove ~70–90% of BOD/COD. Plants often select packaged activated sludge systems or integrate membrane bioreactors to compact the footprint and stabilize effluent for downstream AOP and membranes.
Advanced oxidation processes (AOPs)
Even after coag/floc — and often after biology — residual dyes and dissolved organics persist. AOPs generate hydroxyl radicals (•OH) that non‑selectively degrade recalcitrant molecules. Common variants include Fenton’s reagent (Fe²⁺ + H₂O₂, sometimes catalyzed by UV or chelating agents), ozonation (O₃), UV/H₂O₂ photolysis, photocatalysis (TiO₂/UV), and electrochemical oxidation. UV sources used in photolysis steps can be integrated with industrial ultraviolet units.
Bench‑scale studies show AOPs can remove >90% of color and degrade most remaining COD; a heterogeneous photo‑Fenton system achieved 90–98% color removal of reactive dyes in minutes (pmc.ncbi.nlm.nih.gov). Because textile wastewater often starts with very high COD (hundreds to thousands mg/L), AOPs are typically applied after a first‑stage biological step — biology removes part of the COD, then AOP “polishes” the refractory fraction.
Energy matters. Xu et al. (2021) report median electrical energy per order (E_EO) for Fenton at ~0.98 kWh per m³ per log reduction, far lower than 3–4 kWh/m³ for ozonation or photolysis (www.mdpi.com). Ultrasound‑based AOPs are far higher — ~971 kWh/m³ (www.mdpi.com).
Full‑scale data back this up. A 47,000 m³/d viscose plant used a fluidized‑bed Fenton post‑treatment and achieved ~85% color and ~90% COD removal (bio‑treated effluent COD ~60→20–40 mg/L) at an energy cost of only ~3.2 kWh/m³ (www.mdpi.com). That plant met stringent discharge limits at a net cost of CNY 1.62/m³ (~USD 0.23/m³) (www.mdpi.com).
Design anchors: Fenton often runs with H₂O₂ doses of 0.1–0.5 g/L and Fe/oxidant ratios around 1:1–1:3 (by weight) at pH~3; ozonation contactors commonly aim for 5–20 mg/L O₃ dose over minutes. Fenton’s drawback is the need to acidify to pH ≈3–4 and the generation of iron sludge. Ozonation and UV avoid sludge but require higher electrical energy and are sensitive to the water matrix. In practice, up‑flow bioreactors can reduce COD to ~50–80 mg/L, after which a Fenton stage drops COD to ~20–40 mg/L and ADMI color to single digits (www.mdpi.com).
Other AOP variants (photo‑Fenton, UV/TiO₂, Fenton‑like with chelates, ozonation) have been demonstrated to remove >90% of dyes and 70–80% of COD in lab studies (pmc.ncbi.nlm.nih.gov) (www.mdpi.com). Performance is tracked by remaining COD, TOC, and color; many plants report double‑digit COD (20–50 mg/L) and color <10 ADMI (www.mdpi.com).
Membrane filtration for polishing and reuse
Membranes provide a physical barrier to dyes, salts, and organics and are especially useful for reuse and ultraclean discharge. UF (ultrafiltration) can remove most suspended solids and large dye molecules (~90% dye rejection; pmc.ncbi.nlm.nih.gov), NF (nanofiltration) yields ~95–99% dye/salt rejection, and RO (reverse osmosis) yields essentially complete removal of organics and salts. Plants typically specify ultrafiltration as pretreatment, followed by nanofiltration or brackish-water RO for desalination and final color removal.
Buscio et al. (2016) reported NF membranes removed ~98% of reactive dye content (pmc.ncbi.nlm.nih.gov). Even UF can lower colored organics by ~90%. RO pilots showed selected membranes achieve >97% TOC and color removal to meet reuse standards (pmc.ncbi.nlm.nih.gov) (pmc.ncbi.nlm.nih.gov).
Recent tests with commercial RO — including DuPont Filmtec BW and Vontron fibers — on dyeing/finishing effluent produced permeate meeting stringent reuse limits (COD <30 mg/L, conductivity <100 μS/cm) at ~60–70% recovery (pmc.ncbi.nlm.nih.gov) (pmc.ncbi.nlm.nih.gov). Specifiers often choose elements from Filmtec or Toray families to match target flux and rejection.
Membranes demand careful pretreatment: clarified water (via coag/floc and filtration) avoids rapid fouling. Plants may add fine filtration before UF using modular skids; for example, pre‑UF cartridges or housings are paired with the UF rack. Even with pretreatment, fouling by organic polymers and salts is significant, and periodic cleaning/backwashing is required. Typical operating pressures: UF 1–5 bar; NF 5–15 bar; RO 15–40 bar; energy runs ~1–5 kWh/m³ depending on recovery and salt load. Salt rejection is excellent — RO permeate can be near deionized quality, enabling reuse while dye molecules are retained in the concentrate stream. Data from Chinese reuse plants show >99% removal of dyes and organics, with permeate COD below 10–20 mg/L post‑RO (pmc.ncbi.nlm.nih.gov).
Adoption is growing globally as part of zero‑liquid discharge (ZLD) or reuse goals. While capital and operational costs are high, water scarcity trends increase the appeal. Notably, NF has gained interest for its balance of flux (lower pressure) and high dye rejection, and UF/MF remain important for removing flocs before finer treatment (pmc.ncbi.nlm.nih.gov). For integrated supply, some facilities standardize on complete membrane systems for industrial water treatment.
Integrated treatment train and outcomes
A comprehensive system typically includes: equalization (balancing flows/pH), pH neutralization, coagulation‑flocculation (polyaluminum or iron coagulant), clarification (sedimentation), biological oxidation (e.g., aerated activated sludge or MBR) to remove ~70–90% of BOD/COD, advanced oxidation polishing (e.g., Fenton’s reagent), and finally membrane filtration (UF/NF/RO). Primary clarification can be delivered via a conventional clarifier or a compact module such as a lamella settler when footprint is constrained.
The stages are additive. For example, if coag‑floc removes 80% of color and biology slashes COD 70%, an AOP step removing 85% of the remaining COD and color can reach <100 mg/L COD and near‑zero color. In practice, engineered systems report final effluent with COD below 50 mg/L and decolorization to single‑digit ADMI (often meeting Class I discharge criteria) (www.mdpi.com) (pmc.ncbi.nlm.nih.gov).
Measurable outcomes align across scales: the viscose mill example achieved ~85% color and ~90% COD removal with bio‑treated effluent COD ~60→20–40 mg/L at ~3.2 kWh/m³ (www.mdpi.com); jar‑tests routinely show >90% TSS removal and ~70–90% color removal (www.ncbi.nlm.nih.gov); membrane trials report >95% total organics removal (pmc.ncbi.nlm.nih.gov). Fenton stages typically run at ~3 kWh/m³ (~$0.20/m³) (www.mdpi.com), and membranes add roughly 1–3 kWh/m³ more depending on recovery.
Cost anchors and standards
Designing to Indonesian — and global — standards requires up‑front data. Combining coagulation and biological steps dramatically reduces the load on expensive polishing. Budget anchors: alum at ~$0.1–0.3/kg; H₂O₂ at ~$0.5–1/kg; energy at $0.10–0.20/kWh; and capital for tanks, membranes, and AOP reactors. The full treatment chain is expected to produce effluent BOD/COD/TSS within Indonesian limits (www.scribd.com), typically at unit treatment costs in the range of US$0.2–0.5/m³ (www.mdpi.com), depending on scale. Reuse systems with NF/RO can generate purified water for re‑use, aligning with regulatory pressure and corporate sustainability goals. For procurement and lifecycle planning, standardized modules like membrane systems help de‑risk execution.
At‑a‑glance summary
Textile dye effluent demands a robust multi‑barrier approach. Chemical coagulation/flocculation is the first “knockdown” for color and solids (removing >80% of these; www.ncbi.nlm.nih.gov). Advanced oxidation then breaks down remaining dyes and organics (typically >80–90% removal) in a relatively small‑volume flow. Membrane filtration finally traps any residual color and salts (>>95% removal, yielding reuse‑quality water) (pmc.ncbi.nlm.nih.gov) (pmc.ncbi.nlm.nih.gov). With proper design and operation, this approach is data‑backed to meet stringent discharge standards while optimizing costs and energy use (www.mdpi.com) (www.mdpi.com).
Sources and references
Sources: Recent studies and reports were used. Numerical data are drawn from peer‑reviewed research on textile wastewater treatment (www.ncbi.nlm.nih.gov) (www.mdpi.com). Energy and cost metrics come from full‑scale plant data (www.mdpi.com) (www.mdpi.com). Indonesian effluent standards are from government regulations (www.scribd.com).
References: Daud et al. 2023 (www.ncbi.nlm.nih.gov); Xu et al. 2021 (www.mdpi.com) (www.mdpi.com); Buscio et al. 2016 (pmc.ncbi.nlm.nih.gov); Wei et al. 2023 (pmc.ncbi.nlm.nih.gov); Greenpeace East Asia (2020) (www.planetcustodian.com); Kementerian LHK RI (2019, Permen P.16) (www.scribd.com).
