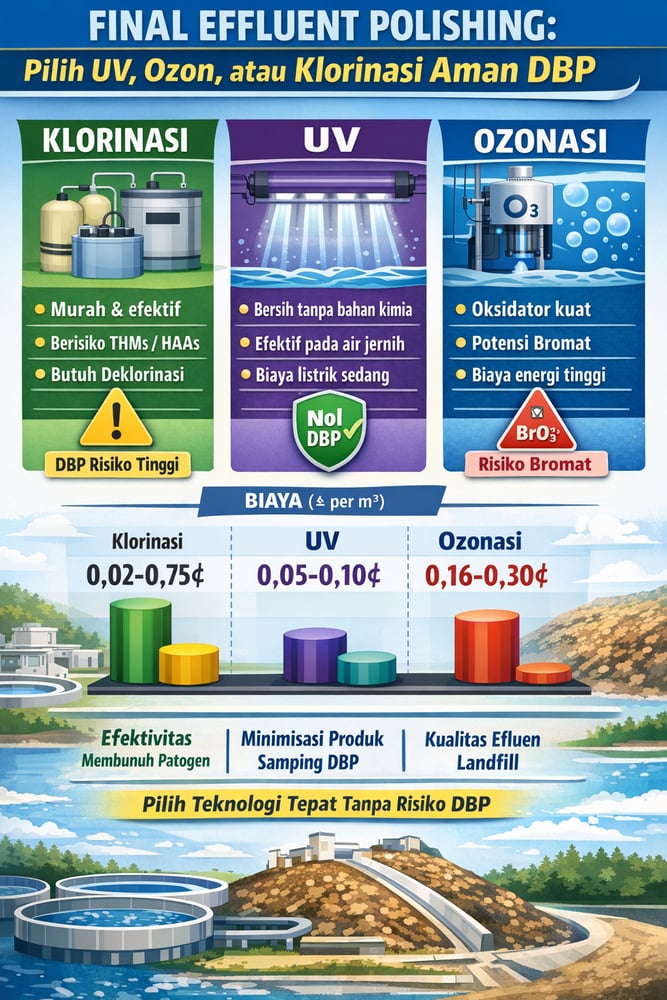
Chlorine stays cheap at scale but makes halogenated by‑products and often needs neutralization. UV avoids those DBPs entirely yet leaves no residual. Ozone is a powerful oxidant with its own by‑product risks and the highest energy bill.
Here’s the cost whiplash: at roughly 6,800 m³/d, chlorination can run about 2 ¢/m³ for a 5 mg/L dose (paperzz.com). At small facilities, the curve flips—unit costs can jump to $0.75/m³ at ~90 m³/d while UV remains comparatively steady (paperzz.com).
What’s more, the technology choice determines not just pathogen kill but which disinfection by‑products (DBPs) a plant must live with—or avoid. For landfill final effluent polishing, that trade‑off shapes everything from chemical buys to community risk tolerance.
Chlorination/dechlorination performance and costs
Chlorine—usually fed as liquid sodium hypochlorite or chlorine gas—is a proven disinfectant that leaves a residual. In practice, chlorine “CT” (concentration × time) requirements span ~0.1–5 mg·min/L for bacteria and viruses depending on pH and water quality; for example, hepatitis A virus needs ~0.4–0.9 mg·min/L for 4‑log inactivation (pmc.ncbi.nlm.nih.gov). In clean laboratory water, as little as 0.04 mg·min/L can yield 4‑log E. coli removal, but secondary effluent organics can raise CT more than twenty‑fold (≈2 mg·min/L in lab vs ~10 mg·min/L in real effluent) (pmc.ncbi.nlm.nih.gov).
On protozoa, the picture splits: Cryptosporidium oocysts are essentially resistant (4‑log CT ≈ 3,600 mg·min/L; pmc.ncbi.nlm.nih.gov), whereas Giardia cysts can be killed at ≈5 mg/L × 10 min (≈50 mg·min/L) for multi‑log inactivation (paperzz.com). Bottom line: chlorine reliably inactivates bacteria and many viruses at modest CT—often <10 mg·min/L (pmc.ncbi.nlm.nih.gov)—but is slow on protozoan cysts.
Cost and operations favor simplicity. Feed systems can be as basic as a dosing pump, and energy demand is modest. Chemical costs (sodium hypochlorite at roughly $50–100/ton) are often lower than UV or ozone per log‑removal at large flow rates (paperzz.com). Where very high CTs are required (e.g., Giardia), both chlorine consumption and dechlorination costs climb. The residual can be a feature in distribution systems, but for final effluent it typically means neutralization via agents such as dechlorination agents (e.g., sodium bisulfite), which adds handling and chemical cost.
Chlorine‑driven DBPs and regional context
Chlorination is the most DBP‑prone pathway. In wastewater matrices, it forms regulated trihalomethanes (THMs) and haloacetic acids (HAAs) whenever organics are present. One study measured THMs and nine different HAAs in chlorine‑treated wastewater samples (researchgate.net), and THM concentrations can easily reach tens of µg/L—often higher than in drinking water. These organohalides pose health and ecotoxic concerns, so many regions limit residual Cl₂ or THMs in effluent. Notably, Indonesian leachate regulations emphasize BOD/COD and metals and do not set microbial or DBP limits, implying disinfection is a design choice rather than a legal requirement (intilab.com).
Ultraviolet sterilization: dose, clarity, and costs
UV‑C irradiation (commonly 254 nm) physically inactivates microbes by DNA damage and uses no added chemicals. In a typical secondary‑effluent UV reactor, a 40 mJ/cm² dose (~0.04 kJ/m³) can achieve >3‑log reduction of Giardia and Cryptosporidium, while many viruses see ~1‑log at 40 mJ/cm² and ~3‑log at 140 mJ/cm² (paperzz.com). To reach 4‑log virus kill, doses often range 10–150 mJ/cm² (paperzz.com and paperzz.com), with some viruses (e.g., adenovirus) more UV‑resistant. UV is fast (seconds of exposure), but turbidity and suspended solids can “shadow” microbes, so high clarity (often referenced at <5 NTU) is required.
Capital and O&M revolve around lamps, reactors, electricity, and periodic lamp replacement. On a volumetric basis, UV is competitive: one analysis estimated ~1–3 ¢/m³ for a 6,814 m³/d plant (40–140 mJ/cm² dose; paperzz.com)—comparable to large‑scale chlorine. It also scales well downward: at 91 m³/d, UV cost remained ~ $0.05/m³ (40 mJ/cm²), whereas chlorine spiked to ~$0.75/m³ (paperzz.com). Another analysis found UV disinfection at ~100 m³/d (40 mJ/cm²) was ~$0.63/m³ cheaper than chlorine overall, mostly due to lower chemical needs (paperzz.com).
UV’s DBP profile is its headline advantage. Because no halogen is added, it does not produce halogenated DBPs such as THMs or HAAs; organics can be fragmented to aldehydes or acids at high doses, but these are smaller concentrations and not regulated as in chlorination. UV can also break down NDMA precursors. The flip side: UV leaves no residual disinfectant, so downstream regrowth risk is not checked—acceptable for direct discharge, but reuse may require a secondary disinfectant. Installations reflect the trend: by 2019, there were >7,000 municipal UV systems globally, and the UV market expanded to roughly $2.8 billion by 2020 (mdpi.com; same source for both figures). Implementations commonly specify ultraviolet systems, supported by routine cleaning and sensors available under water‑treatment ancillaries.
Ozonation efficacy, energy, and by‑products
Ozone (O₃) is a very strong oxidant generated on‑site from oxygen. As a disinfectant, it can quickly inactivate bacteria and viruses: laboratory data indicate a CT near 1 mg·min/L can achieve >4‑log virus kill and ~3‑log Giardia reduction, though only ~0.5‑log Cryptosporidium (paperzz.com). Ozone is often paired with hydrogen peroxide or UV as an Advanced Oxidation Process (AOP) to boost hydroxyl radical (•OH) formation and improve disinfection and organic removal, but here ozone alone is considered.
The cost center is electricity. Ozone must be generated on‑site, typically consuming ~5–20 kWh per kg O₃. Analyses indicate ozonation may cost tens of cents more per m³ than chlorine; one study found ozone ~16 ¢/m³ more expensive than chlorine at ~100 m³/d (paperzz.com). Like UV, ozone leaves essentially no residual—ozone decays rapidly—so downstream contamination is possible unless a small chlorine residual is added (some systems do a post‑chlorine step).
DBPs differ from chlorine’s. Ozone avoids THMs and most halogenated DBPs but can form bromate (BrO₃⁻) by oxidizing bromide, even from a few hundred µg/L, with WHO and many regulators limiting bromate near ~10 µg/L. Ozone also converts organics into smaller compounds—aldehydes (formaldehyde, acetaldehyde), ketones, and carboxylic acids are common by‑products (researchgate.net). One study found ozonation of treated wastewater produced detectable formaldehyde and acetaldehyde while chlorination produced THMs/HAAs (researchgate.net). These organics are usually at low mg/L or µg/L levels, are less regulated than THMs, and may contribute to oxygen demand or prompt downstream polishing (e.g., biofiltration). Ozonation often improves effluent taste/odor and reduces biodegradable organics.
Effectiveness, cost, and DBP trade‑offs
Effectiveness. All three methods can achieve high pathogen kill if properly applied. Ozone is the most powerful oxidant: viruses can be inactivated (4‑log) at very low CT (~1 mg·min/L; pmc.ncbi.nlm.nih.gov), lower than typical chlorine CT (often <10 mg·min/L; same source) and less affected by organic interference. UV requires sufficient lamp energy (often tens to >100 mJ/cm²) and is excellent on Giardia and Cryptosporidium that chlorine largely misses. At 40 mJ/cm², UV yields >3‑log on Cryptosporidium/Giardia; at 140 mJ/cm², ~3‑log on viruses (paperzz.com). Chlorine at ~5 mg/L × 10 min can kill Giardia and achieve ~4‑log on many viruses (paperzz.com), but is virtually ineffective (<0.5‑log) on Cryptosporidium without impractically long contact.
Cost. Chlorination is typically cheapest at large scale—roughly $0.02–0.04/m³ at thousands of m³/d (paperzz.com)—but per‑unit cost rises at very small flows. UV has higher capital and electricity needs but minimal consumables; at ~100 m³/d and 40 mJ/cm², UV was ~$0.63/m³ cheaper than chlorine overall (paperzz.com). Ozone generally costs the most: one analysis found ozone ~ $0.16/m³ above chlorine at 100 m³/d (paperzz.com), driven by on‑site generation energy and equipment.
DBPs. Chlorine presents the greatest DBP risk—THMs, HAAs, and, if chlorine dioxide is used, chlorite/chlorate—often at dozens of µg/L in chlorinated effluent (researchgate.net). UV alone produces essentially no regulated halogenated DBPs—only minor oxygenated fragments—an unambiguous advantage. Ozone avoids THMs but can generate bromate (µg/L range) and carbonyls (μg–mg/L formaldehyde/acetaldehyde) (researchgate.net, researchgate.net). By DBP profile alone, UV ranks lowest, ozone next (non‑halogenated), then chlorine.
Selection drivers and hybrid schemes
For final effluent discharge, UV or ozone are often preferred where minimizing toxic by‑products is critical. Chlorination remains attractive for its low cost and simplicity—especially at large scale—but typically requires dechlorination chemicals and DBP liability management. UV is a strong match when organic DBP precursors are present (no halogenation occurs), though its lack of residual means it cannot control downstream re‑growth. Ozone provides multi‑contaminant removal (pathogens and some micropollutant/organic oxidation) and can improve effluent odor/color, but budgeting for bromate control and higher energy use is essential. In practice, hybrid schemes—UV plus trace chlorine residual, or ozone followed by biofiltration—are sometimes used to balance these trade‑offs.
Any selection turns on site‑specific realities: effluent quality (organics, turbidity, bromide), required pathogen log‑removal, local energy prices, and regulatory drivers (including DBP limits). For systems that pursue chlorine, simple feed skids anchored by a dosing pump and follow‑on neutralization using a dechlorination agent align with the operational picture above. UV‑centric trains will specify UV equipment and instrumentation from supporting ancillaries, consistent with the performance and DBP data cited here.
Sources: cost and scale comparisons for chlorine and UV (paperzz.com; paperzz.com), small‑plant cost trends and UV’s differential (~$0.63/m³ at ~100 m³/d; paperzz.com), ozone’s cost premium (~$0.16/m³ at 100 m³/d; paperzz.com); disinfection efficacy data (CT and dose/log‑kill) from literature surveys (paperzz.com; pmc.ncbi.nlm.nih.gov; pmc.ncbi.nlm.nih.gov; pmc.ncbi.nlm.nih.gov; pmc.ncbi.nlm.nih.gov); DBP formation patterns for chlorination vs ozonation (THMs/HAAs vs aldehydes; researchgate.net; researchgate.net); UV adoption and market size (>7,000 municipal installations by 2019; market ~$2.8 billion by 2020; mdpi.com); Indonesian leachate parameters and the absence of microbial/DBP limits (intilab.com).
